
Hood River Electric Coop
Electric cooperative
About 7.25¢/kWh. Outside the Energy Trust area.
Hood River rates and solar rulesSolar panel and battery installation in Hood River, Oregon
Solar and battery systems sized to Hood River sun and Hood River rates, designed and installed by a local Oregon crew.
A south-facing solar system in Hood River produces about 1,276 kWh per installed kW each year, according to NREL's PVWatts model. A home using about 11,000 kWh a year needs roughly 8.6 kW (20 panels) here, and a 7.5 kW system offsets about $694 of Hood River energy charges in its first year.
Hood River homes in the Columbia Gorge pair well with solar plus storage, adding energy independence on top of Hood River Electric Coop's low base rates.
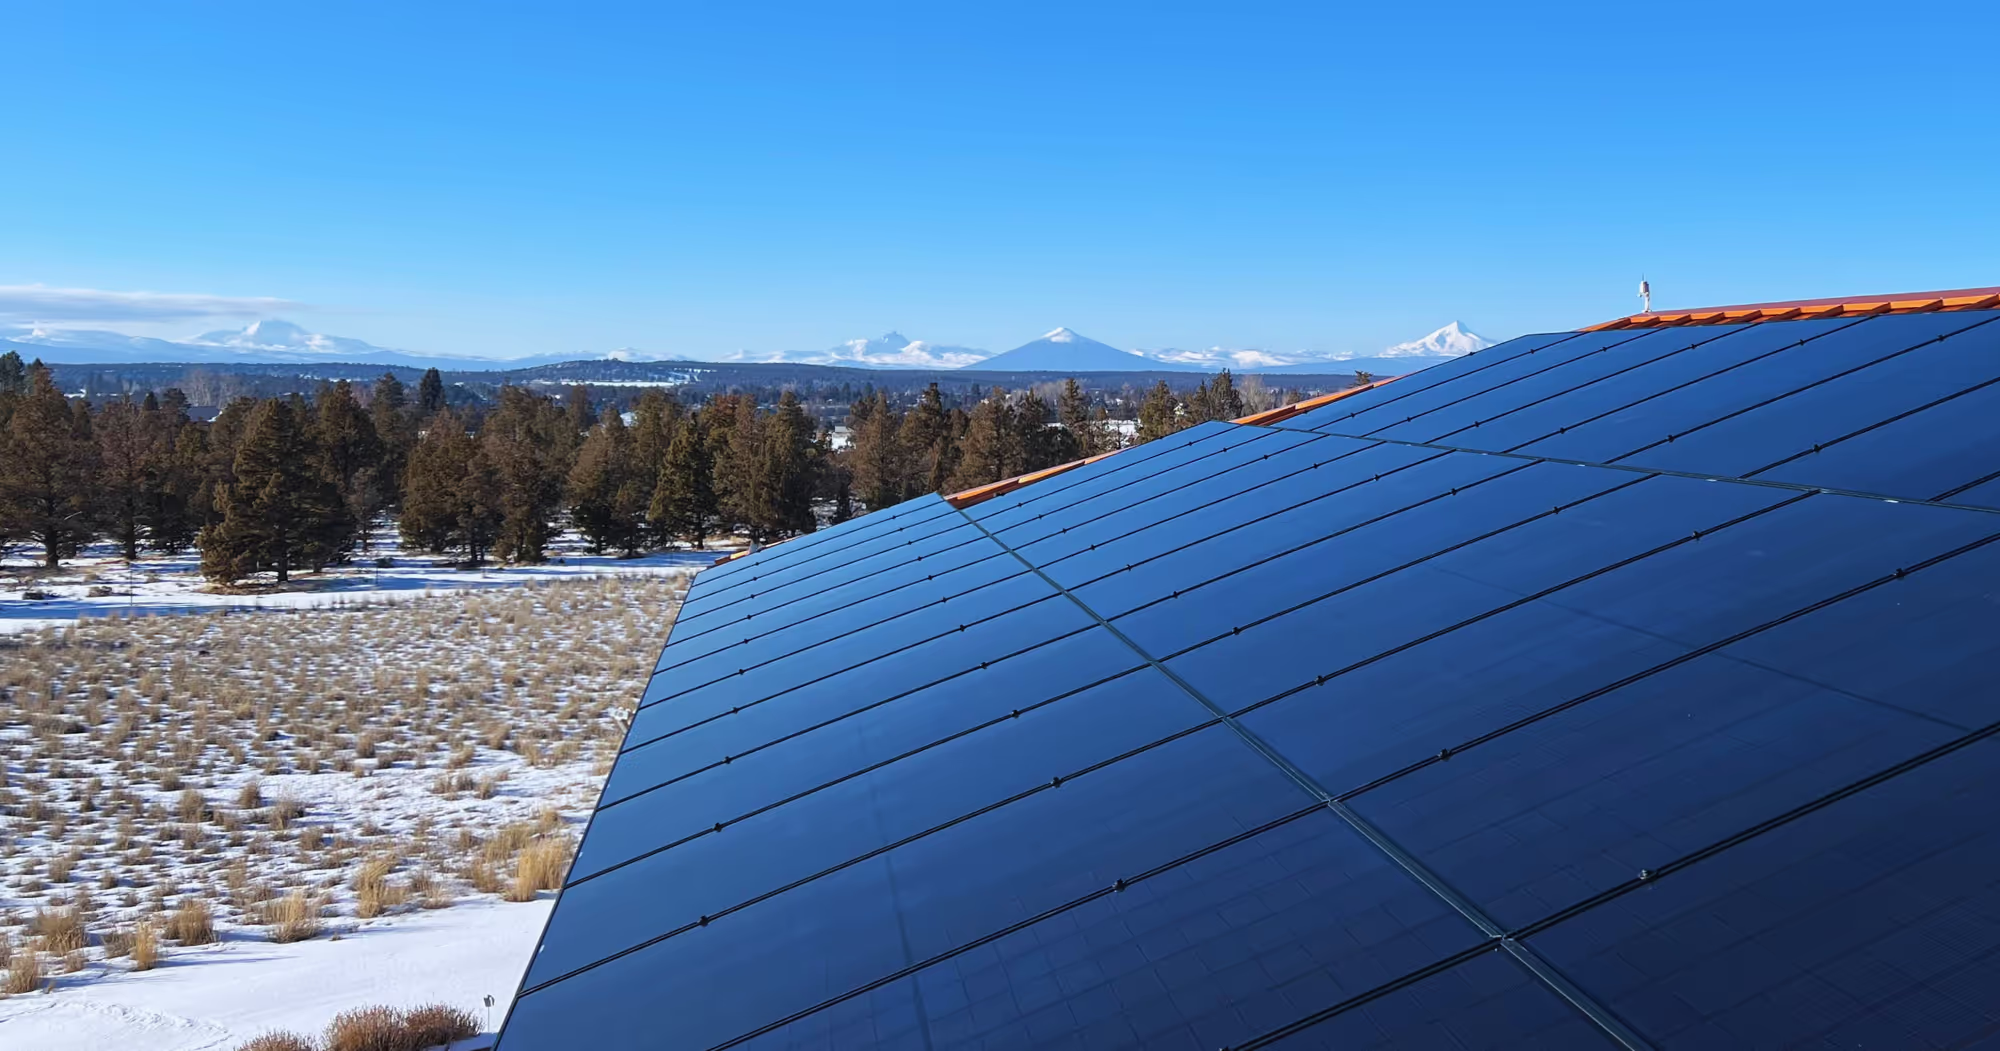
High-desert sun and cold, clear winters are close to ideal for solar: panels run more efficiently in cold air, and snow slides off tilted modules within a day or two of a storm. Racking and attachments are specified for local snow loads.
National Solar has completed 2 projects in Hood River, so our crews already know Hood River County permitting and Hood River interconnection here.
July is the strongest month at about 1,328 kWh; December is the weakest at 278 kWh. Net metering carries summer surplus into winter.
| Jan | 300 kWh |
|---|---|
| Feb | 525 kWh |
| Mar | 713 kWh |
| Apr | 968 kWh |
| May | 1110 kWh |
| Jun | 1170 kWh |
| Jul | 1328 kWh |
| Aug | 1200 kWh |
| Sep | 938 kWh |
| Oct | 660 kWh |
| Nov | 375 kWh |
| Dec | 278 kWh |
Your utility sets your rate, net metering rules and which incentives apply. Check the name on your bill.
Electric cooperative
About 7.25¢/kWh. Outside the Energy Trust area.
Hood River rates and solar rulesInvestor-owned utility
About 17¢/kWh, plus a ~$14 monthly fixed charge. Energy Trust incentives apply.
Pacific Power rates and solar rulesSee what your utility charges today and how much it has climbed since 2021. Enter your bill to get your personalized Price of Power report.
Tap your county, or enter your ZIP.
Shaded by each county's primary utility. Faded counties aren't served by Pacific Power.
One free estimate. Two ways to get it.
Free. No obligation.
Hundreds of 5-star reviews from Bend to the coast, from customers who chose a local team they can still call years after installation.
Production: NREL PVWatts v8 (NSRDB weather data) at Hood River's U.S. Census coordinates (45.709, -121.526), 1 kW, 20° tilt, south-facing, 14% system losses. Rates: average residential energy charges reported by each utility. Install counts: National Solar project records. Data updated 2026-10-20. Your roof's direction, shading and usage change the numbers, so your free assessment uses your actual address and bills.
Choose a time for your visit, then share a few details about your home.
Pick a visit type, day, and time. We'll ask for your details next.
National Solar
Free solar estimate
| Su | Mo | Tu | We | Th | Fr | Sa |
|---|---|---|---|---|---|---|